Because therapeutic drugs incorporate organic compounds with many different structures, they are often susceptible to transformations induced by light or other external factors. In addition to promoting discoloration that can degrade drug effectiveness or quality of life, these transformations may create decomposition products that cause side effects or otherwise prevent drugs from delivering appropriate therapeutic benefits.
The photostability of drug substances and formulations is characterized by conducting experimental tests in accordance with Stability Testing: Photostability Testing of New Drug Substances and Products ratified by the International Council for Harmonisation of Technical Requirements for Pharmaceuticals for Human Use (ICH), a collaboration between the U.S., the E.U., and Japan. The data required for these tests may be acquired via a wide variety of analytical methods, including high-performance liquid chromatography (HPLC) and gas chromatography mass spectrometry (GC-MS); although these methods play important roles, they cannot be easily used to visualize the temporal evolution of degradation processes.
Fluorescent fingerprints, also known as excitation-emission matrices (EEMs), are three-dimensional contour maps in which fluorescent intensity is plotted vs. excitation wavelength and fluorescent wavelength, yielding graphical signatures—resembling human fingerprints—that are characteristic of specific substances. Combining this measurement strategy with the method of multivariate analysis known as parallel factor analysis (PARAFAC) yields EEM-PARAFAC, a chemometric technique capable of analyzing EEMs—which are superpositions of spectral contributions from multiple component substances—to separate and identify the signatures of each individual component.1) Despite impressive progress in applications of this technique for purposes such as water-quality monitoring and quality control for agricultural products and foodstuffs,2-7) to date there have been almost no attempts to use EEM-PARAFAC for assessing pharmaceutical stability.8) In this paper, motivated by the goal of visualizing the photodegradation of pharmaceutical substances, we develop a new technique for characterizing photostability via EEM-PARAFAC analysis.9)
We began by using EEM-PARAFAC analysis to study the photodegradation of chlorpromazine hydrochloride(CPZHCl), a phenothiazine-based antipsychotic known to exhibit poor photostability. As a first step, we assessed the linearity of the relationship between the fluorescence intensity and the CPZHCl concentration in a methanol solution; our results indicated that this relationship was indeed highly linear over the concentration range 5-25 μM. We next prepared a 10 μM solution of CPZHCl in methanol, irradiated this solution with 365 nm light from an LED source, and measured the temporal evolution of the absorption and fluorescence spectra at 25°C under an oxygen environment (Figure 1). CPZHCl exhibits absorption bands in the ultraviolet region, with density functional theory calculations indicating that the absorption band near 260 nm is due to π-π* transitions in phenothiazine rings, while the weak absorption band near 310 nm is due to n-π* transitions in sulfur atoms. A blue fluorescence peak is also observed near 450 nm. Under irradiation by LED light, the shape of the absorption band changes—with a long-wavelength tail emerging—and the visual appearance of the solution changes from colorless to orange-colored. The fluorescence spectrum is also significantly blueshifted, with the peak wavelength decreasing to around 375 nm. Repeating the experiment for solutions prepared with different solvents (dichloromethane, acetonitrile, dimethylformamide, water) yielded nearly identical shifts in the absorption and fluorescence spectra under photoirradiation.
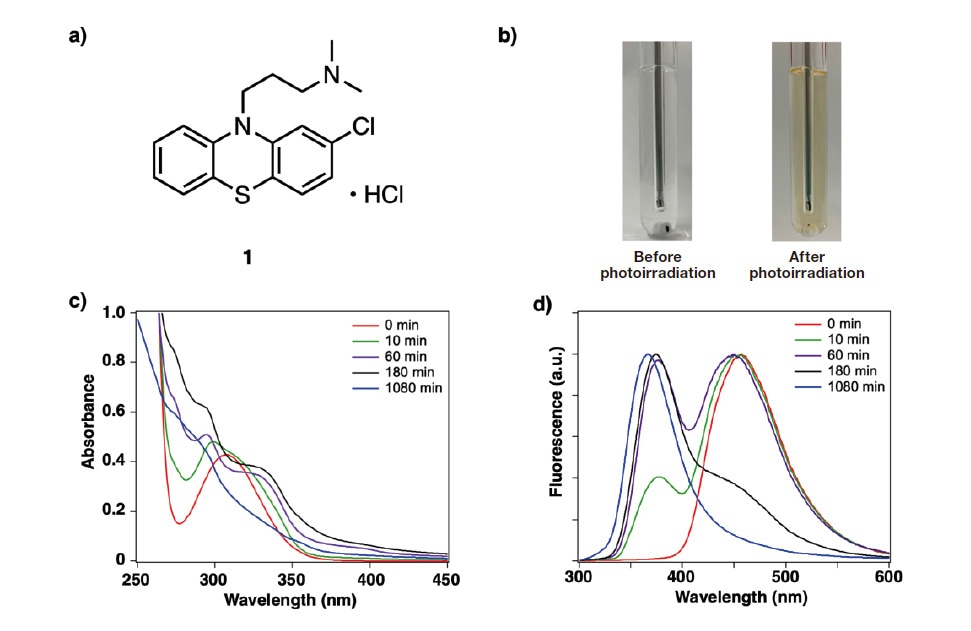
Fig. 1
a) Structure of chlorpromazine hydrochloride (CPZHCl).
b) Under photoirradiation, CPZHCl solution changes from colorless, transparent liquid to orange-colored liquid.
c,d) Temporal variation in absorption (c) and fluorescence (d) spectra of CPZHCl methanol solution. Time is measured from the start of photoirradiation.
We next used EEMs to monitor the temporal progression of CPZHCl photodegradation in a methanol solution. Under sustained photoirradiation, the contour map of fluorescence intensity for CPZHCl—which is originally concentrated near a wavelength of em≈450 nm and excitation wavelengths of ex≈{260,310} nm—transforms into a new contour map concentrated in the ranges em≈300-450 nm and ex≈200-350 nm. Applying PARAFAC analysis to separate the spectrum into three components (C1, C2, C3) as shown in Figure 2, we find that the C1 spectrum initially exhibits peaks at (em,ex)≈(450,{260,310}) nm, but after 30 min of photoirradiation, these peaks have weakened, while new peaks have emerged in the C2 spectrum near (em,ex)≈(375,{250,275,335}) nm and in the C3 spectrum near (em,ex)≈(355,{240,290}) nm. Note that the C3 spectrum emerges more slowly than the C2 spectrum. For this EEM-PARAFAC model, the core consistency (a benchmark indicating whether or not the number of components was chosen correctly) was 91%.
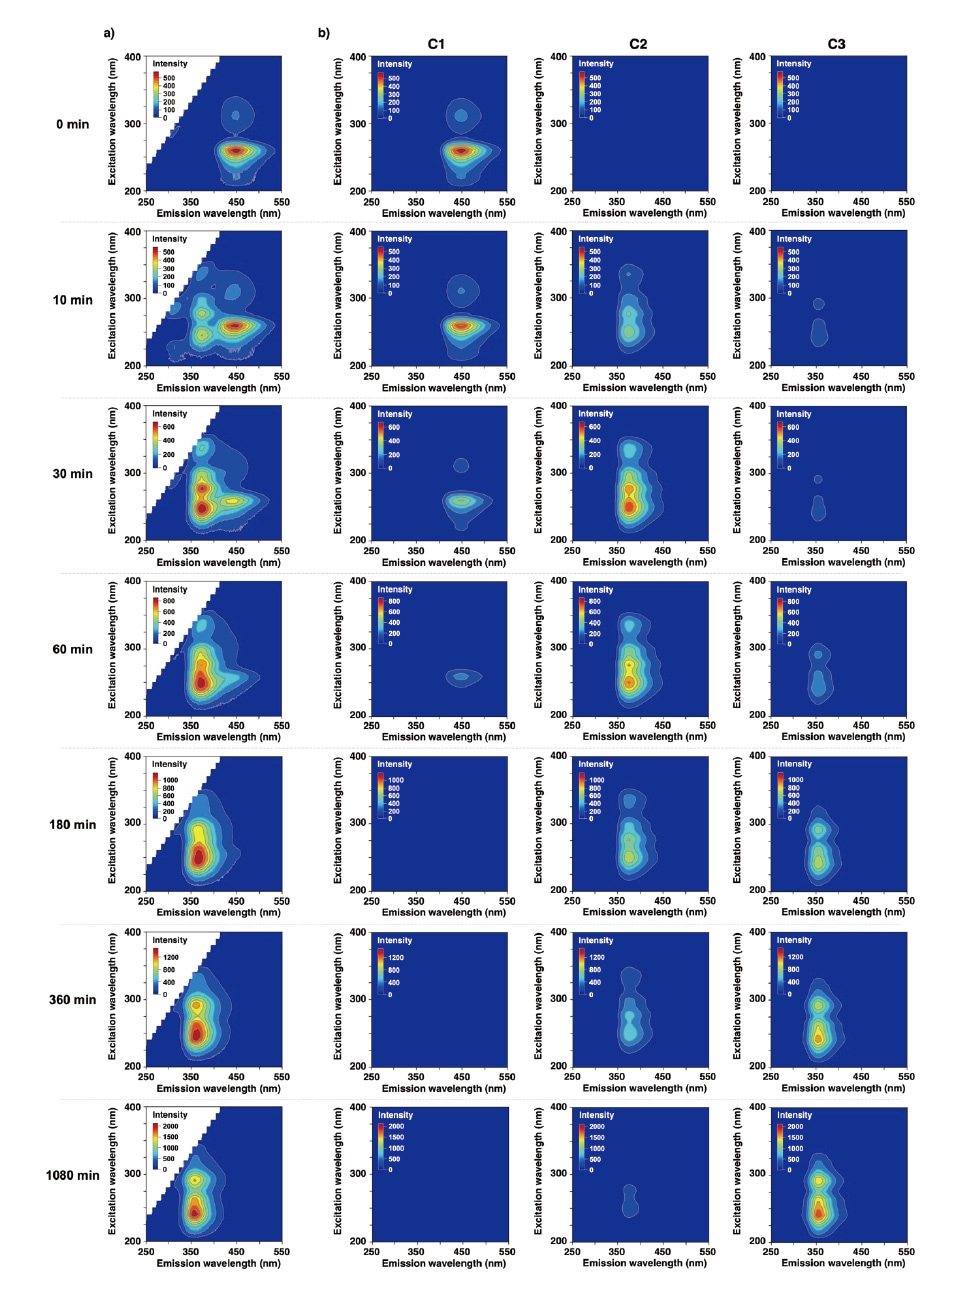
Fig. 2
a) Temporal variation in EEM spectrum of CPZHCl methanol solution under photoirradiation. Time is measured from the start of photoirradiation.
b) Results of PARAFAC analysis. For this model, the assumption of three independent components yielded a successful separation result.
As a further validation of the correctness of the number of components chosen for our EEM-PARAFAC separation analysis, we next identified the reaction products generated by CPZHCl photodegradation and studied the chemical structures and EEM spectra of these substances. We first exposed a 10 mM ethanol solution of CPZHCl to 365 nm light from an LED source for 18 h under an oxygen environment, and then used silica-gel chromatography to separate and refine the resulting mixture of reaction products. This analysis shows that the primary reaction product is phenothiazine hydrochloride sulfoxide (PHS) produced by oxidation of CPZHCl, and single-crystal X-ray structure analysis successfully determined the crystal structure of this PHS. Next, we used nuclear magnetic resonance spectroscopy to determine the structure of the secondary reaction product 2-chloro-N,N-dimethylcarbazole (2CNND). Our analysis found trace quantities of oxide reaction products corresponding to the molecular formulas C17H19ClN2SO and C17H19ClN2SO3.
Our next step was to prepare methanol solutions of the photodegradation products PHS and 2CNND, measure their EEM spectra, and compare the results to the C2 and C3 spectra obtained via PARAFAC component-separation analysis. The results, shown in Figure 3, indicate that the contour map for PHS exhibits peaks near (em,ex)≈(375,{275,335}) nm—matching the C2 spectrum in Figure 2—while the contour map for 2CNND exhibits peaks near (em,ex)≈(355,{240,265,290}) nm, matching the C3 spectrum in Figure 3. These results confirm the success of our EEM-PARAFAC analysis based on a three-component model.
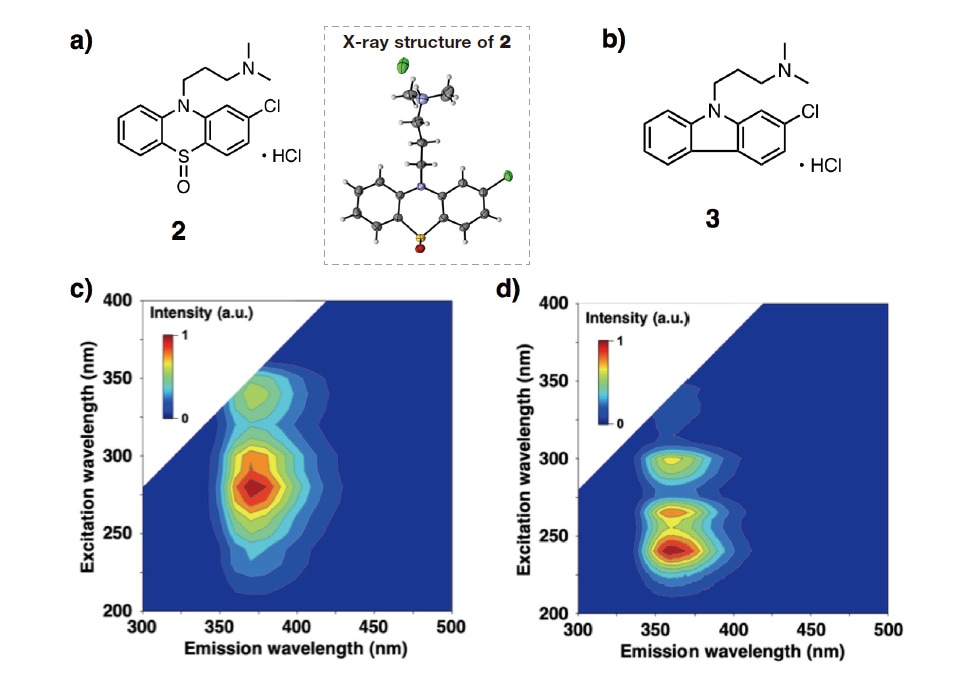
Fig. 3
a) Chemical structure of phenothiazine hydrochloride sulfoxide (PHS).
b) Chemical structure of 2-chloro-N,N-dimethylcarbazole (2CNND).
c) EEM spectrum of methanol solution of PHS.
d) EEM spectrum of methanol solution of 2CNND.
Finally, we conducted a kinetic-theory based analysis to yield quantitative insight into the photodegradation reaction of CPZHCl. We use the notation [CPZHCl]0 to denote the initial concentration of CPZHCl, the symbol t to denote the light-irradiation time in minutes, and the symbol I to denote the fluorescence intensity for the C1 spectrum at (em,ex)=(450,260) nm. We also denote by Qem(t) the fractional decrease in this intensity after time t; Qem(t) is computed from the initial intensity (I0) and the intensity after time t(It) via Equation (1). Multiplying [CPZHCl]0 by Qem(t) then gives the concentration of CPZHCl remaining after t min of photoirradiation.

Figure 4 plots the decrease in CPZHCl concentration vs. the light-irradiation time; from this profile, we conclude that the degradation of CPZHCl proceeds via a first-order reaction. Using a Matplotlib implementation of the Levenberg- Marquardt method of nonlinear fitting, we fit the data in Figure 4 using the function in Equation (2); this yields a value of k1=8.7×10⁻³ min-1 for the reaction-rate constant, corresponding to a half-life (t1/2) of 80 min for the photodegradation reaction.
![[1] = [1]0e^-k1t (2)](/image/global/sinews/si_report/130222/index_06.jpg)
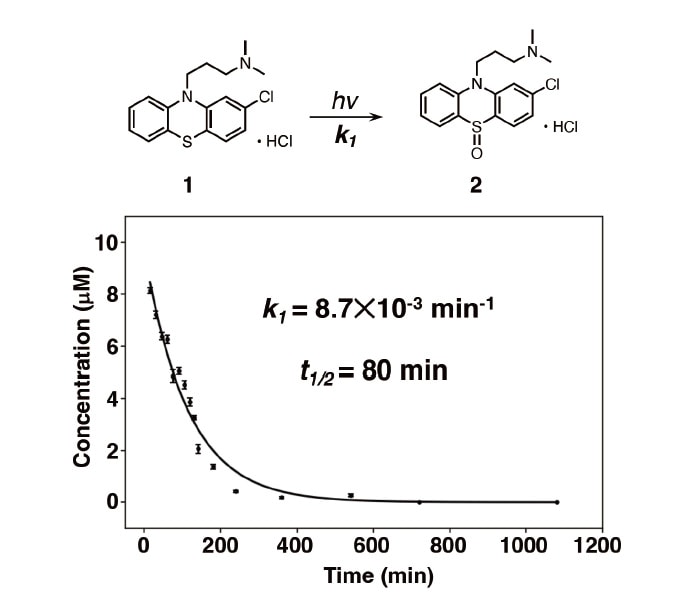
Fig. 4 Kinetic-theory based analysis of photodegradation of CPZHCl.
As a final demonstration of the efficacy of the methods described in this paper, we performed an EEM-PARAFAC analysis to characterize the photostability of two phenothiazine-based antipsychotics with differing side chains: levomepromazine maleate (LM) and prochlorperazine maleate (PM). We observed no significant differences between these compounds in the progress of photodegradation; in both cases, the peaks in the spectrum of the drug substance (C1) vanished quickly after the onset of photoirradiation, with new peaks gradually emerging in the spectra for sulfoxide (C2) and carbazole (C3)—thus demonstrating successful visualization of the temporal evolution of photodegradation. By determining the relative concentrations of the three components and observing the temporal evolution of the concentration distribution, we found that over 50% of the drug substance had decomposed after 10 min of photoirradiation. Our analysis also shows that the carbazole reaction product emerged more slowly than the sulfoxide reaction product; however, after 180 min of irradiation, carbazole accounted for 55% of the concentration distribution (Figure 5).
These results demonstrate the efficacy of EEM-PARAFAC analysis for characterizing the photostability of phenothiazine-based antipsychotics. Our approach allows the photodegradation of drug substances to be visualized in the form of contour maps. Compared to methods such as HPLC or GC-MS, it has the advantage of providing quantitative insights into drug substance photodegradation with no need for component separation via column chromatography—and requires significantly smaller quantities of drug substance samples, solvents, and other consumables.
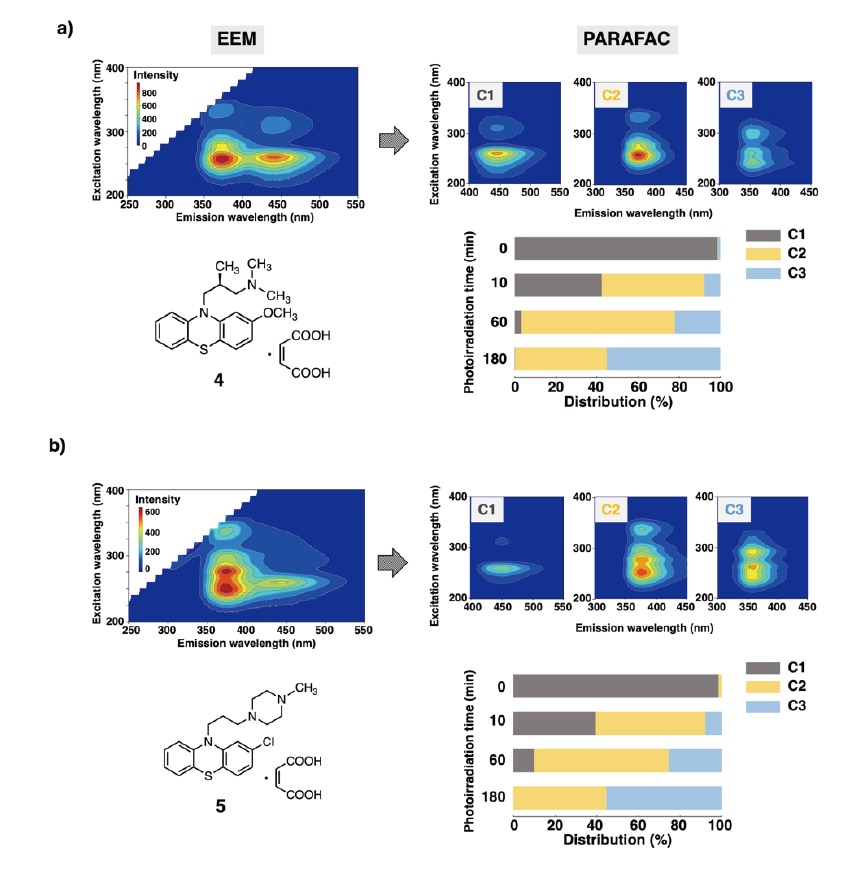
Fig. 5
a) Photostability of levomepromazine maleate (LM)
b) Photostability of prochlorperazine maleate (PM)
The data required to characterize the photostability of drug substances and formulations may be acquired via a wide variety of analytical methods. Although these methods play important roles, they cannot be easily used to visualize the temporal evolution of degradation processes. In this paper we presented a new method we have developed for analyzing the photostability of pharmaceuticals via EEM-PARAFAC analysis. Our method allows visualization, via mapping, of the temporal progression of photodegradation of drug substances, and can also compute relative concentrations of individual components based on intensity values and a kinetic-theory based analysis of photodegradation reactions, thus yielding quantitative information on degradation processes.
Pharmacists and other health-care professionals often work with drugs that may be unstable under light exposure. These professionals should have information beforehand to appropriately handle light-sensitive drug substances to ensure that quality is preserved at all stages of the therapeutic process, from drug storage, the preparation of drug formulations, through to the administration of drug therapies. For example, the phenothiazine-based antipsychotic studied in this work is packaged with a package insert specifying appropriate usage guidelines and precautions, such as: After opening the package, store this drug in a dark place to avoid degradation and discoloration due to light exposure. Do not use this drug if it appears to have changed color. Our EEM-PARAFAC analysis also revealed that the primary reaction product resulting from the photodegradation of this drug was a transparent, colorless oxide.
The external appearance of pharmaceuticals—their color and shape—is easily judged by visual inspection and thus constitutes a useful benchmark for checking drug stability; nonetheless, proper administration of drug therapies requires accurate identification of degradation pathways and degradation products. The ability of EEM-PARAFAC to furnish such insights quickly and easily will make this technique a powerful tool—and a promising platform for practical implementations of regulatory science for quality control of pharmaceuticals and other products.
References
See more