Polymer electrolyte membrane fuel cells (PEMFCs), which use hydrogen as a source of energy, are widely expected to furnish crucial power sources for future sustainable low-carbon societies.1,2) Reducing the cost of PEMFCs is a key prerequisite for ensuring their growth, and one particularly urgent challenge—with particularly significant cost reducing potential—is to establish techniques for minimizing the platinum content of catalyst layers in these devices. One natural first step in this direction is to increase platinum utilization efficiency, and this approach has been pursued in many previous studies.2-5) Catalyst layers typically have 3-dimensional porous structures comprising carbon supported platinum nanoparticles (Pt/C) and proton-conductive polymers (ionomers).6) The rate-limiting step in the basic battery reaction is the oxygen-reduction reaction (ORR) occurring at the cathode catalyst layer, in which protons and electrons generated at the anode react at platinum nanoparticle sites with oxygen gas supplied from the exterior to produce water. The diffusion of protons and of oxygen is governed by the structure of the catalyst layer—specifically, by the connectivity of the pores (or voids) and the ionomer distribution—and can give rise to ORR overvoltages; for this reason, careful control of the structure of catalyst layers, and cathode catalyst layers in particular, is essential.7) Achieving catalyst structures that effectively exploit proton and oxygen diffusion requires careful fine-tuning8) of various details—including optimizing the composition of the catalyst solution (known as ink and containing Pt/C, ionomers, and dispersing agents) and perfecting the battery assembly process—and, although there do exist certain protocols that have been recommended for standardization, one suspects that each individual research group and manufacturer has developed its own idiosyncratic and zealously-guarded set of procedures.
The ease of controlling the relative abundance of ionomers in the ink (measured by the ratio of ionomers to carbon, I/C) has made this parameter a common target of optimization efforts.9-18) The basic tradeoff is that reducing I/C tends to increase oxygen diffusivity, but reduces proton conductivity by closing off proton-conduction pathways.10) The solvent used for the ink is also known to affect PEMFC performance and has been extensively studied, with most research focusing on two-component solvents combining water with alcohols such as methanol, ethanol, or 2-propanol.19-31)
The blend ratio of alcohol and water in such solvents has been the focus of several studies. Van Cleve et al. reported that water-rich ink (83 wt% water) decreased ORR activity due to strong interactions between Pt and the sulfonic acid in ionomers, while water-poor ink (24 wt% water) led to the formation of large ionomer aggregates that obstructed oxygen diffusion in catalyst layers; these authors concluded that PEMFC performance was optimized by ink made with a solvent of intermediate water content (62 wt% water).30) This finding was contradicted by Orfanidi et al., who reported higher performance for a water-poor (16 wt%) ink than for a relatively water-rich (65 wt%) ink, and interpreted this result as follows: whereas ionomer aggregates formed in water-rich inks obstruct voids in catalyst layers thereby obstructing oxygen diffusion, water-poor (i.e. alcohol-rich) inks yield greater uniformity in the distribution of ionomers, resulting in the formation of contiguous proton-conduction pathways on Pt surfaces that ensure good performance.29) These studies demonstrate that interactions between carbon surfaces and ionomers and solvent molecules in ink solutions are key factors governing the distribution of ionomers and the contiguity of void regions in catalyst layers. However, to date there has been no systematic quantitative analysis of the impact of solvent composition on adsorption between ionomers and catalysts.
In this study, we measure adsorption isotherms to characterize ionomer adsorption behavior—both on carbon carriers and on Pt/C—in inks made with two aqueous ethanol solutions: one with high water content (80 wt% water, which we term the water-rich solvent) and one with low water content (13 wt% water, which we term the alcohol-rich solvent). We then assemble fuel cells with catalyst layers made from these two inks and compare their battery performance.
The ionomer we use is Nafion, the most widely-used PFSA (perfluorosulfonic acid, a polymer based on fluorinated polyethylene) offering excellent proton conductivity.32) The carbon source we use is Vulcan (CB), also a common choice. Figure 1 shows adsorption isotherms quantifying the adsorption of Nafion on CB for both water-rich (blue curves) and alcohol-rich (black curves) solvents. Adsorption of Nafion was characterized by 19F-NMR, which offers higher quantitative accuracy than mass-based methods33) or density measurements.34) Although in this study we consider alcohol/water blended solvents, 19F-NMR measurements of Nafion adsorption isotherms have also been reported for ink made with water alone as a solvent.35-37) Plots of adsorption vs. equilibrium Nafion concentration (Ce) show a 2-step profile for both water-rich and alcohol-rich solvents; this indicates multilayer adsorption, as is also seen with pure-water solvents.35-38) The chemical structure of the CB surface is non-uniform, and theory suggests that adsorption on such non-uniform surfaces should not be well described by the Langmuir model; nonetheless, fitting to a Langmuir profile yields R2 values above 0.95, suggesting good statistical significance. Using these Langmuir fits to compute equilibrium adsorption constants (KL) for first-layer adsorption of Nafion on CB yields a higher value for the water-rich solvent (KL=89) than for the alcohol-rich solvent (KL=32), indicating stronger interactions in the water-rich case. The maximum adsorption capacity (Γmax) for first-layer adsorption is also larger for the water-rich solvent (Γmax=0.043 mg/mg) than for the alcohol-rich solvent (Γmax=0.024 mg/mg), indicating that the water-rich solvent not only yields stronger interactions but is also beneficial for adsorption (Table 1). We interpret this result as follows: In the water-rich solvent, hydrophobic CF2 primary chains are preferentially adsorbed on CB surfaces due to hydrophobic interactions; in the alcohol-rich solvent, by contrast, Nafion is solvated by alcohol molecules, preventing adsorption from proceeding effectively. One interesting observation is that first-layer adsorption begins at a concentration near Ce≈0.04 mg/mL in the water-rich solvent, but at a lower concentration near Ce≈0.02 mg/mL in the alcohol-rich solvent. It is known39-40) that, in water-rich solvents, Nafion forms bundles due to strong hydrophobic interactions between CF2 primary chains, while in alcohol rich solvents the behavior more closely resembles individual dissolution due to solvation on CF2 primary chains caused by alcohol molecules; the decrease in apparent concentration we observe for the water-rich solvent suggests that such a reversal phenomenon may be occurring here as well. It is remarkable that adsorption-isotherm measurements alone suffice to illuminate such a wide variety of curious phenomena. These observations suggest that the large value of Γmax observed for the water-rich solvent reflects not only strong adsorption forces but also the formation of Nafion bundles.

Fig. 1 Adsorption isotherms for Nafion on CB (a,c) and for Nafion on CB/Pt (b,d). Plots (a) and (b) show adsorption per unit mass, while plots (c) and (d) show adsorption per unit surface area. Blue and black curves respectively denote results for water-rich and alcohol-rich solvents.
Table 1 Plots of KL, Γmax, and Γ'max for Nafion absorption on CB and CB/Pt.

We also analyzed Nafion adsorption behavior for CB-supported Pt (CB/Pt, platinum/support ratio 46 wt%), and the results are shown in Figure 1(b). For this case we obtained values of KL=29 and KL=25 respectively for the waterrich and alcohol-rich solvents, considerably lower than the values for CB (Table 1). This demonstrates that, irrespective of solvent alcohol content, interactions between Nafion and Pt surfaces are weaker than interactions between Nafion and CB surfaces.38) Similarly, Γmax values for CB/Pt are lower than those for CB, with the decrease being particularly prominent for the water-rich solvent (Figure 1(b)).
When working with Pt, a heavy atom, one must account for the possibility that adsorption may be underestimated. To address this possibility, we augment our comparison of Γ (adsorption per unit mass) by additionally comparing adsorption per unit surface area, which we denote Γ'. The quantity Γ' has units of mg/m2 and is normalized by the BET surface area (m2/g) as determined from nitrogen adsorption measurements. Comparing Γ' values for the waterrich solvent, we find Γ'max=0.209 mg/m2 for CB and Γ'max=0.188 mg/m2 for CB/Pt, a trend similar to that observed for Γ values. This suggests that, in the water-rich solvent, Nafion is preferentially adsorbed on CB surfaces rather than Pt surfaces. In contrast, for the alcohol-rich solvent we find values of Γ'max=0.179 mg/m2 for CB/Pt and Γ'max=0.116 mg/m2 for CB, indicating that, under alcohol-rich conditions, Nafion is preferentially adsorbed on Pt surfaces.
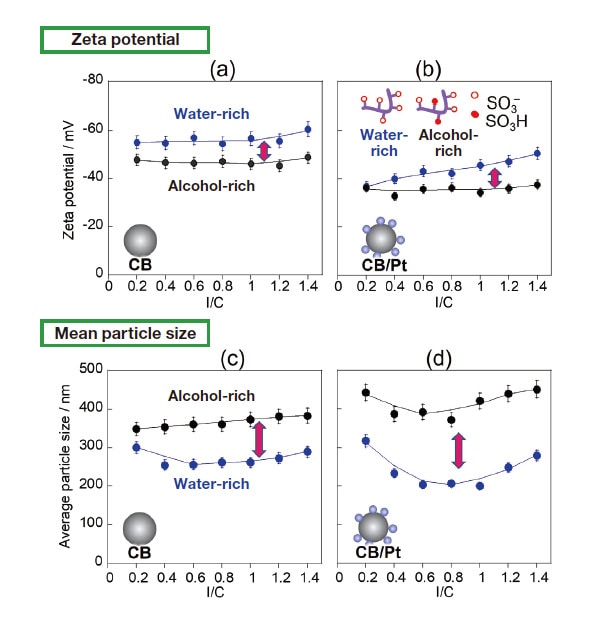
Fig. 2 Upper graphs: Zeta potentials for CB (a) and for CB/Pt (b) in water-rich (blue curves) and alcohol-rich (black curves) solvents.
Lower graphs: Mean particle size for CB (c) and for CB/Pt (d) in water-rich (blue curves) and alcohol-rich (black curves) solvents.
As noted above, measurements of adsorption isotherms demonstrate that Nafion adsorption increases as I/C increases. To investigate how these variations affect the diffusivity of CB and CB/Pt, we used the same inks prepared for adsorption measurements to investigate zeta potentials, particle-size distributions, and diffusion stability. In the absence of Nafion (I/C=0), the aggregation and sedimentation of particles proceeds instantaneously, complicating the measurement of the zeta potential and particle size; this clearly demonstrates the key role played by Nafion in governing diffusion phenomena. On the other hand, as shown in Figure 2(a,b), for I/C > 0.2 the zeta potential is negative, indicating the onset of stable colloidal diffusion due to the impact of sulfonic-acid groups, which acquire a negative charge through ionization. Zeta-potential values are roughly constant independent of I/C, a finding we interpret as follows: At CB and CB/Pt surfaces, there exists not only a surface-adsorbed Nafion layer, but also an additional weakly bound Nafion layer encompassing the surface-adsorption layer. Whereas adsorption isotherm measurements assume only the presence of the surface-adsorption layer, zeta-potential measurements also reflect the impact of the weakly adsorbed Nafion surface layer surrounding it. The larger absolute value of the zeta potential observed for the water-rich solvent reflects greater ionization of sulfonic-acid groups due to higher dielectric permittivity.21) Meanwhile, for both solvents, the absolute value of the zeta potential for CB/Pt is lower than that for CB (Figure 2(b)); we explain this by noting that, in the presence of Pt, the net negative charge of sulfonic-acid groups decreases due to interaction with Pt surfaces.
We next use dynamic scattered-light intensity analysis to measure mean particle sizes for CB (Figure 2(c)) and CB/Pt (Figure 2(d)) in the water-rich (blue curves) and alcohol-rich (black curves) solvents. For both CB and CB/Pt, the mean particle size is smaller and the particle-size distribution is narrower for the water-rich solvent than for the alcohol-rich solvent. This is due to the high particle diffusivity for the water-rich solvent, which in turn results from strong Nafion adsorption and high charge produced by the ionization of sulfonic-acid groups. On the other hand, for the alcohol-rich solvent, and particularly for CB/Pt, the diffusivity is lower, and there exist large particles with sizes above 1.0 μm.
To observe the stability of diffusion behavior, we conducted ink sedimentation experiments over a 14-day period. For CB/Pt ink, the diffusion state remained stable for the water-rich solvent (Figure 3, left), but for the alcohol-rich solvent we observed significant aggregation and sedimentation (Figure 3, right). For the water-rich solvent, Nafion adsorption and the ionization of sulfonic-acid groups give rise to a zeta potential whose absolute value approaches 50 mV, the value considered a benchmark indicator of stable diffusion.41) For the alcohol-rich solvent, by contrast, the effects of ionomer adsorption and sulfonic-acid-group ionization are insufficient to raise the absolute zeta-potential above a relatively small value, resulting in significant aggregation (Figure 4).
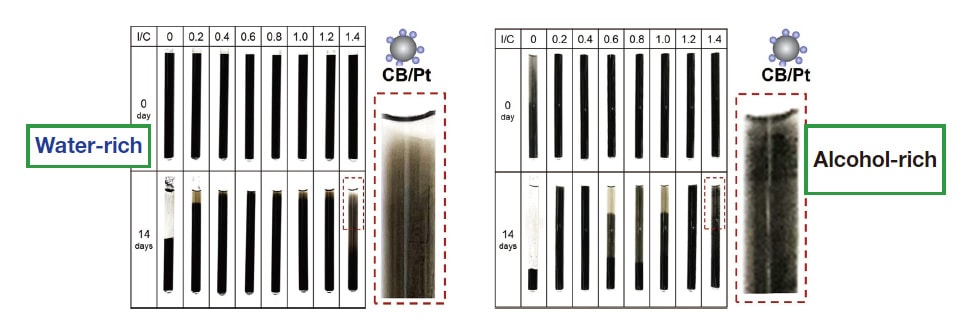
Fig. 3 CB/Pt ink sedimentation tests for water-rich (left) and alcohol-rich (right) solvents.
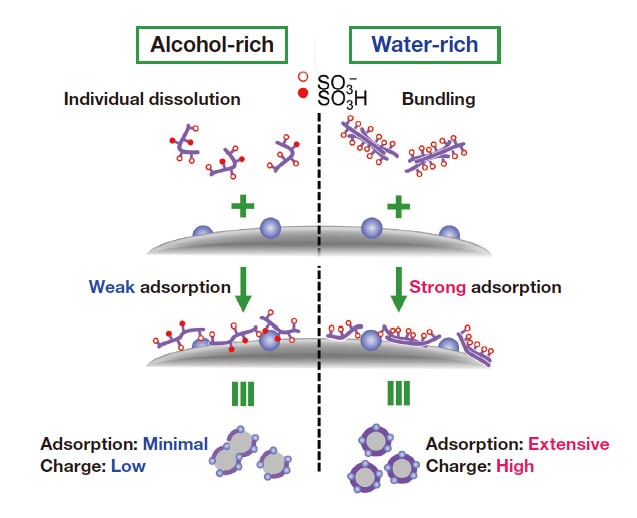
Fig. 4 Conceptual illustration of Nafion adsorption on CB/Pt in alcohol-rich (left) and water-rich (right) solvents.
Table 2 Zeta potentials for catalyst-layer surfaces.

To investigate how the quantity and ionization state of sulfonic-acid groups on catalyst surfaces in inks are reflected in actual catalyst layers, we coated PET substrates with inks made using water-rich and alcohol-rich solvents (with I/C values of 0.6 and 1.0) and measured the zeta potential for the catalyst-layer surfaces. For I/C values of 0.6 and 1.0, the surface zeta potential for the ink-sprayed catalyst layers was ‒8.3 and ‒10.7 mV, respectively, for the water-rich solvent and ‒3.3 and ‒4.5 mV, respectively, for the alcohol-rich solvent (Table 2). As these zeta-potential measurements were all conducted in a water medium, the ionization state of sulfonic-acid groups was identical in all cases, and thus differences in measured values reflect the quantity of sulfonic-acid groups present at catalyst-layer surfaces. Thus we conclude that ionomer volumes are greater at catalyst-layer surfaces prepared from water-rich solvents. We explain this as follows: In water-rich solvents, ionomers adhere strongly to catalyst surfaces and remain adsorbed on these surfaces even after drying, whereas ionomer adsorption is weaker in alcohol-rich solvents, resulting in fewer residual sulfonic-acid groups. But where do ionomers go in alcohol-rich solvents? We suggest that that capillary forces cause ionomers to remain at deeper positions, where they serve to obstruct void regions between CB/Pt aggregates after drying.
To investigate how the different Nafion-adsorption behavior observed for water-rich and alcohol-rich solvents affects PEMFC performance, we prepared membrane electrode assemblies (MEAs) containing electrode catalyst layers (Pt content: 0.3 mg/cm2) coated with inks (solid proportion 6 wt%) made with the two types of solvents. In preparing these inks we chose a value of I/C=0.72, in the concentration range corresponding to first-layer adsorption of Nafion.42) We respectively refer to the MEAs made with the water-rich and the alcohol-rich solvents as the w-MEA and the a-MEA. Fig. 5(a-f) shows scanning-electron microscopy images (acquired using an SU9000 SEM system) of catalyst layer surfaces. We first note that, for both solvents, the catalyst-layer surfaces exhibit uniform structures with no major cracks. Interestingly, low-magnification observations of the w-MEA reveal a uniform distribution of voids with diameters on the order of 1-2 μm (Figures 5(a,b)). The template for the formation of this micron-scale void structure was most likely furnished by water droplets.26) In contrast, no similar structure is observed for the a-MEA.
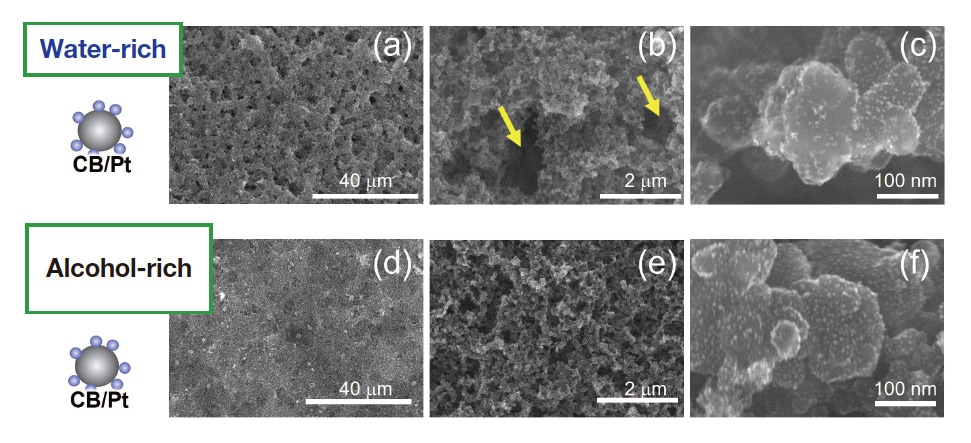
Fig. 5 SEM images of catalyst-layer surfaces in w-MEA (a-c) and a-MEA (d-f). Magnification: 1,300× (a,d); 20,000× (b,e); 300,000× (c,f).
Figure 6(a) shows polarization (I-V) curves for the w-MEA and a-MEA with hydrogen supplied to the anode and air supplied to the cathode (measured at 80°C and relative humidity 100%). The voltage is higher for the w-MEA (blue) than for the a-MEA (black) across the entire range of current densities, with maximum output densities of 750 mW/cm2 for the w-MEA and 580 mW/cm2 for the a-MEA. From AC impedance analysis of these MEAs we find that the proton resistivity of the w-MEA (0.35 Ω /cm) is lower than that for the a-MEA (1.26 Ω /cm); thus the catalyst-layer structure of the w-MEA is more conducive to proton diffusion, offering one reason for its greater activity. Figure 6(b) shows cyclic voltammograms measured for the w-MEA and a-MEA with the cathode and anode respectively subjected to flows of N2 and H2. Based on electrochemically-active surface-area (ECSA) analysis of the hydrogen adsorption/desorption peaks clearly visible in the range 0.1-0.3 V, we determine that the electrochemically accessible Pt surface area is 75.1 m2/g Pt for the w-MEA and 49.3 m2/g Pt for the a-MEA. We attribute the favorable proton-diffusion behavior and larger ECSA observed for the w-MEA to the formation of well-developed ionomer networks stimulating proton transport to the Pt surface. Our adsorption-isotherm measurements clearly showed that Nafion is preferentially adsorbed on CB/Pt surfaces in water-rich solvents, a fact that is surely relevant for the formation of proton-conduction pathways (Figure 7, left). In alcohol-rich solvents, by contrast, Nafion resists adsorption on CB/Pt, and, when catalyst layers are coated in ink, the formation of aggregates in secondary pore regions results in a non-uniform ionomer network, ultimately increasing the resistance to proton diffusion and reducing the ECSA (Figure 7, right).20-21,43)
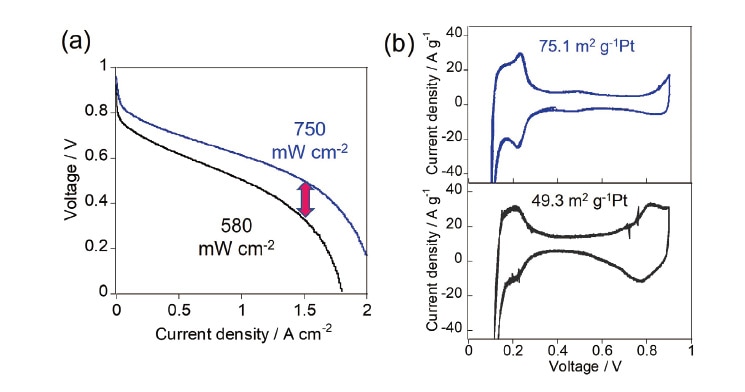
Fig. 6 Polarization curves (a) and in-situ cyclic voltammograms (b) for w-MEA (blue) and a-MEA (black).
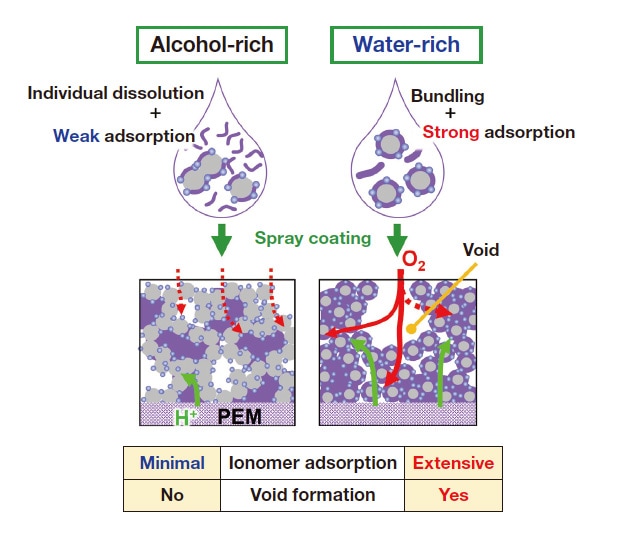
Fig. 7 Conceptual diagram illustrating formation of catalyst layers for alcohol-rich (left) and water-rich (right) solvents.
Oxygen-reduction reactions at cathodes are affected not only by proton diffusion, but also by resistance to oxygen diffusion—which, in turn, is known to depend both on diffusion through ionomers adsorbed on Pt surfaces and on bulk diffusion through catalyst layers. The results of our AC impedance analysis show that resistance to oxygen diffusion is lower for the w-MEA than for the a-MEA. In the alcohol-rich solvent, the adsorption forces binding ionomers to catalyst surfaces are weak, leaving many unadsorbed ionomers that remain in bulk regions of the catalyst layers and obstruct oxygen diffusion through these regions (Figure 7, left). In the water-rich solvent, by contrast, ionomers adhere strongly to catalyst surfaces, leaving void regions unobstructed; moreover, these void regions are interconnected by micropores, forming a structure that is conducive to oxygen diffusion through the bulk (Figure 7, right). Because ionomers adsorbed on Pt surfaces are known to obstruct ORRs by preventing oxygen molecules from being adsorbed on these surfaces, this is a key factor.26,44,45) The results of adsorption isotherm measurements confirm that, in the water-rich solvent, ionomers tend to be adsorbed on carbon surfaces more than on Pt surfaces; in the alcohol-rich solvent, by contrast, ionomers tend to be adsorbed on Pt surfaces. However, at present this observation is based solely on studies of adsorption in ink; in future work we hope to conduct more detailed studies, via electrochemical analysis of catalyst layers and other techniques, to clarify how these mechanisms are reflected in actual adsorption behavior during nonequilibrium states—such as drying processes—or in the presence of overabundant ionomers.
In this study we used adsorption isotherm measurements to demonstrate that differences in the catalyst composition of fuel-cell inks give rise to differences in ionomer adsorption states. We showed that inks based on water-rich solvents are conducive to ionomer adsorption, and that this mechanism not only leads to the formation of proton-conduction pathways but also the preservation of oxygen-diffusion pathways. The ability to regulate ionomer adsorption in catalyst layer surfaces offers direct control over fuel-cell behavior, and our work thus constitutes a new methodology for controlling the performance of fuel cells.46)
References
See more