Application for Biomedicines - Peptide Mapping Method
Biomedicines are protein-based drugs manufactured by applying recombinant DNA technology or cell culture technology and one of the characteristics is that their raw materials are biological-origin polymers. Some guidance and guidelines have been published for the test and evaluation methods.
"Peptide mapping method," one of the methods to identify biomedicines, is introduced here.
The peptide mapping is a method developed to analyze the properties of proteins, evaluate the identity and stability, and detect the mutation. To compare the elution patterns of LC chromatograms showing many peptide peaks, it is extremely important to ensure that the repeatability for the peak retention times and areas are good.
This time, BSA and an antibody drug (IgG), a typical biomedicine, were used as model samples and the repeatability was evaluated based on the LC analysis of their digests.
Summary of Peptide Mapping Method

In this method, the changes in constituting amino acids are confirmed by comparing the chromatographic patterns after the peptide fragments formed by the chemical or enzymatic digestion of proteins are separated and detected by instruments such as LC.
* Peptide mapping is a method specified based on the harmonization of three pharmacopoeias (USP, EP, JP) and is described as a reference in the JP (Japanese Pharmacopoeia) 16th edition.
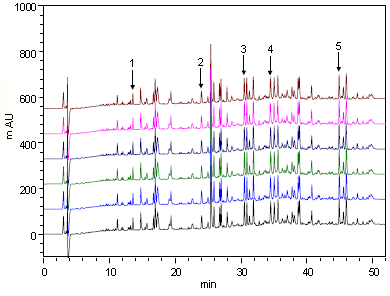
Analysis Example of BSA (Bovine Serum Albumin) Digest

Analysis Conditions
| Column | HITACHI LaChrom C18 (5 µm) (4.6 mm I.D. x 250 mm) |
|---|---|
| Eluents | A)0.1% TFA/H2O(v/v) B)0.1% TFA/CH3CN(v/v) * Gradient |
| Flow rate | 1.0 mL/min |
| Column temperature | 40°C |
| Detection wavelength | UV 215 nm |
| Injection volume | 10 µL |
Sample Preparation

* A dynamic mixer is used.
Peak Retention Time and Peak Area Repeatability (n=6)
Retention Time
| Peak No. | 1 | 2 | 3 | 4 | 5 |
|---|---|---|---|---|---|
| Average | 13.579 | 23.998 | 30.508 | 34.488 | 44.911 |
| SD | 0.009 | 0.012 | 0.012 | 0.018 | 0.012 |
| %RSD | 0.06 | 0.05 | 0.04 | 0.05 | 0.03 |
Peak Area
| Peak No. | 1 | 2 | 3 | 4 | 5 |
|---|---|---|---|---|---|
| Average | 313951 | 477180 | 729175 | 922057 | 814068 |
| SD | 6957 | 11499 | 17599 | 22397 | 21035 |
| %RSD | 2.22 | 2.41 | 2.41 | 2.43 | 2.58 |
When the analysis was repeated six times, the repeatability for the retention times (%RSD) was 0.06% or less and that for the peak areas (%RSD) was 2.6% or less, indicating that extremely good repeatabilities were obtained.
Therefore, it was confirmed that the peptide mapping method allows the highly reliable chromatographic pattern analysis.
Structure of Antibody Drug (IgG)
Among biomedicines, many antibody drugs prepared by making use of antibodies (immunoglobulins) are proteins having glycan structures and they are especially drawing attention for their high specificities and usefulness. While there are several types of immunoglobulins, IgG is mainly put to practical use for antibody drugs and it characteristically has a "Y"-shaped four-chain structure. Two each of the H-chain and Lchain are linked by S-S bonds (disulfide bonds) so as to form a Y-shaped heterotetramer. It is also considered that the structures of the glycans, that are linked due to post translational modifications, largely affect the activities of the medicines.
This time, IgG was subjected to a reductive alkylation and then, trypsin-digested. The fragments of the peptide was analyzed by the LC and the repeatability of the peak retention time and areas were evaluated based on the chromatographic patterns.

Analysis Example of IgG Digest

Analysis Conditions
| Column | HITACHI LaChrom C18(5 µm)(4.6 mm I.D. x 250 mm) |
|---|---|
| Eluents | A)0.1%TFA /H2O(v/v) B)0.1%TFA/CH3CN(v/v) *Gradient |
| Flow rate | 1.0 mL/min |
| Column temperature | 40°C |
| Detection wavelength | UV 215 nm |
| Injection volume | 10 µL |
Sample Preparation

Peak Retention Time and Peak Area Repeatability (n=6)
Retention Time
| Peak No. | 1 | 2 | 3 | 4 | 5 | 6 |
|---|---|---|---|---|---|---|
| Average | 10.960 | 11.934 | 22.716 | 26.630 | 34.979 | 43.647 |
| SD | 0.012 | 0.011 | 0.013 | 0.010 | 0.013 | 0.010 |
| %RSD | 0.11 | 0.09 | 0.06 | 0.04 | 0.04 | 0.02 |
Peak Area
| Peak No. | 1 | 2 | 3 | 4 | 5 | 6 |
|---|---|---|---|---|---|---|
| Average | 131165 | 80680 | 227672 | 135253 | 418818 | 200076 |
| SD | 2547 | 2585 | 6966 | 4474 | 16010 | 8164 |
| %RSD | 1.94 | 3.20 | 3.06 | 3.31 | 3.82 | 4.08 |
When the analysis was repeated six times, the repeatability for the peak retention times (%RSD) was 0.1% or less and that for the peak areas was 4.1% or less, indicating that extremely good repeatabilities were obtained. It was shown that the highly reliable analysis of chromatographic patterns is possible even for complex peptides such as digested IgG.
NOTE:
These data are an example of measurement; the individual values cannot be guaranteed.
The system is for research use only, and is not intended for any animal or human therapeutic or diagnostic use.
In order to read a PDF file, you need to have Adobe® Reader®
